SoundIntel BI
A music chart analytics dashboard where you can ask questions of the data in plain language and get a chart back.
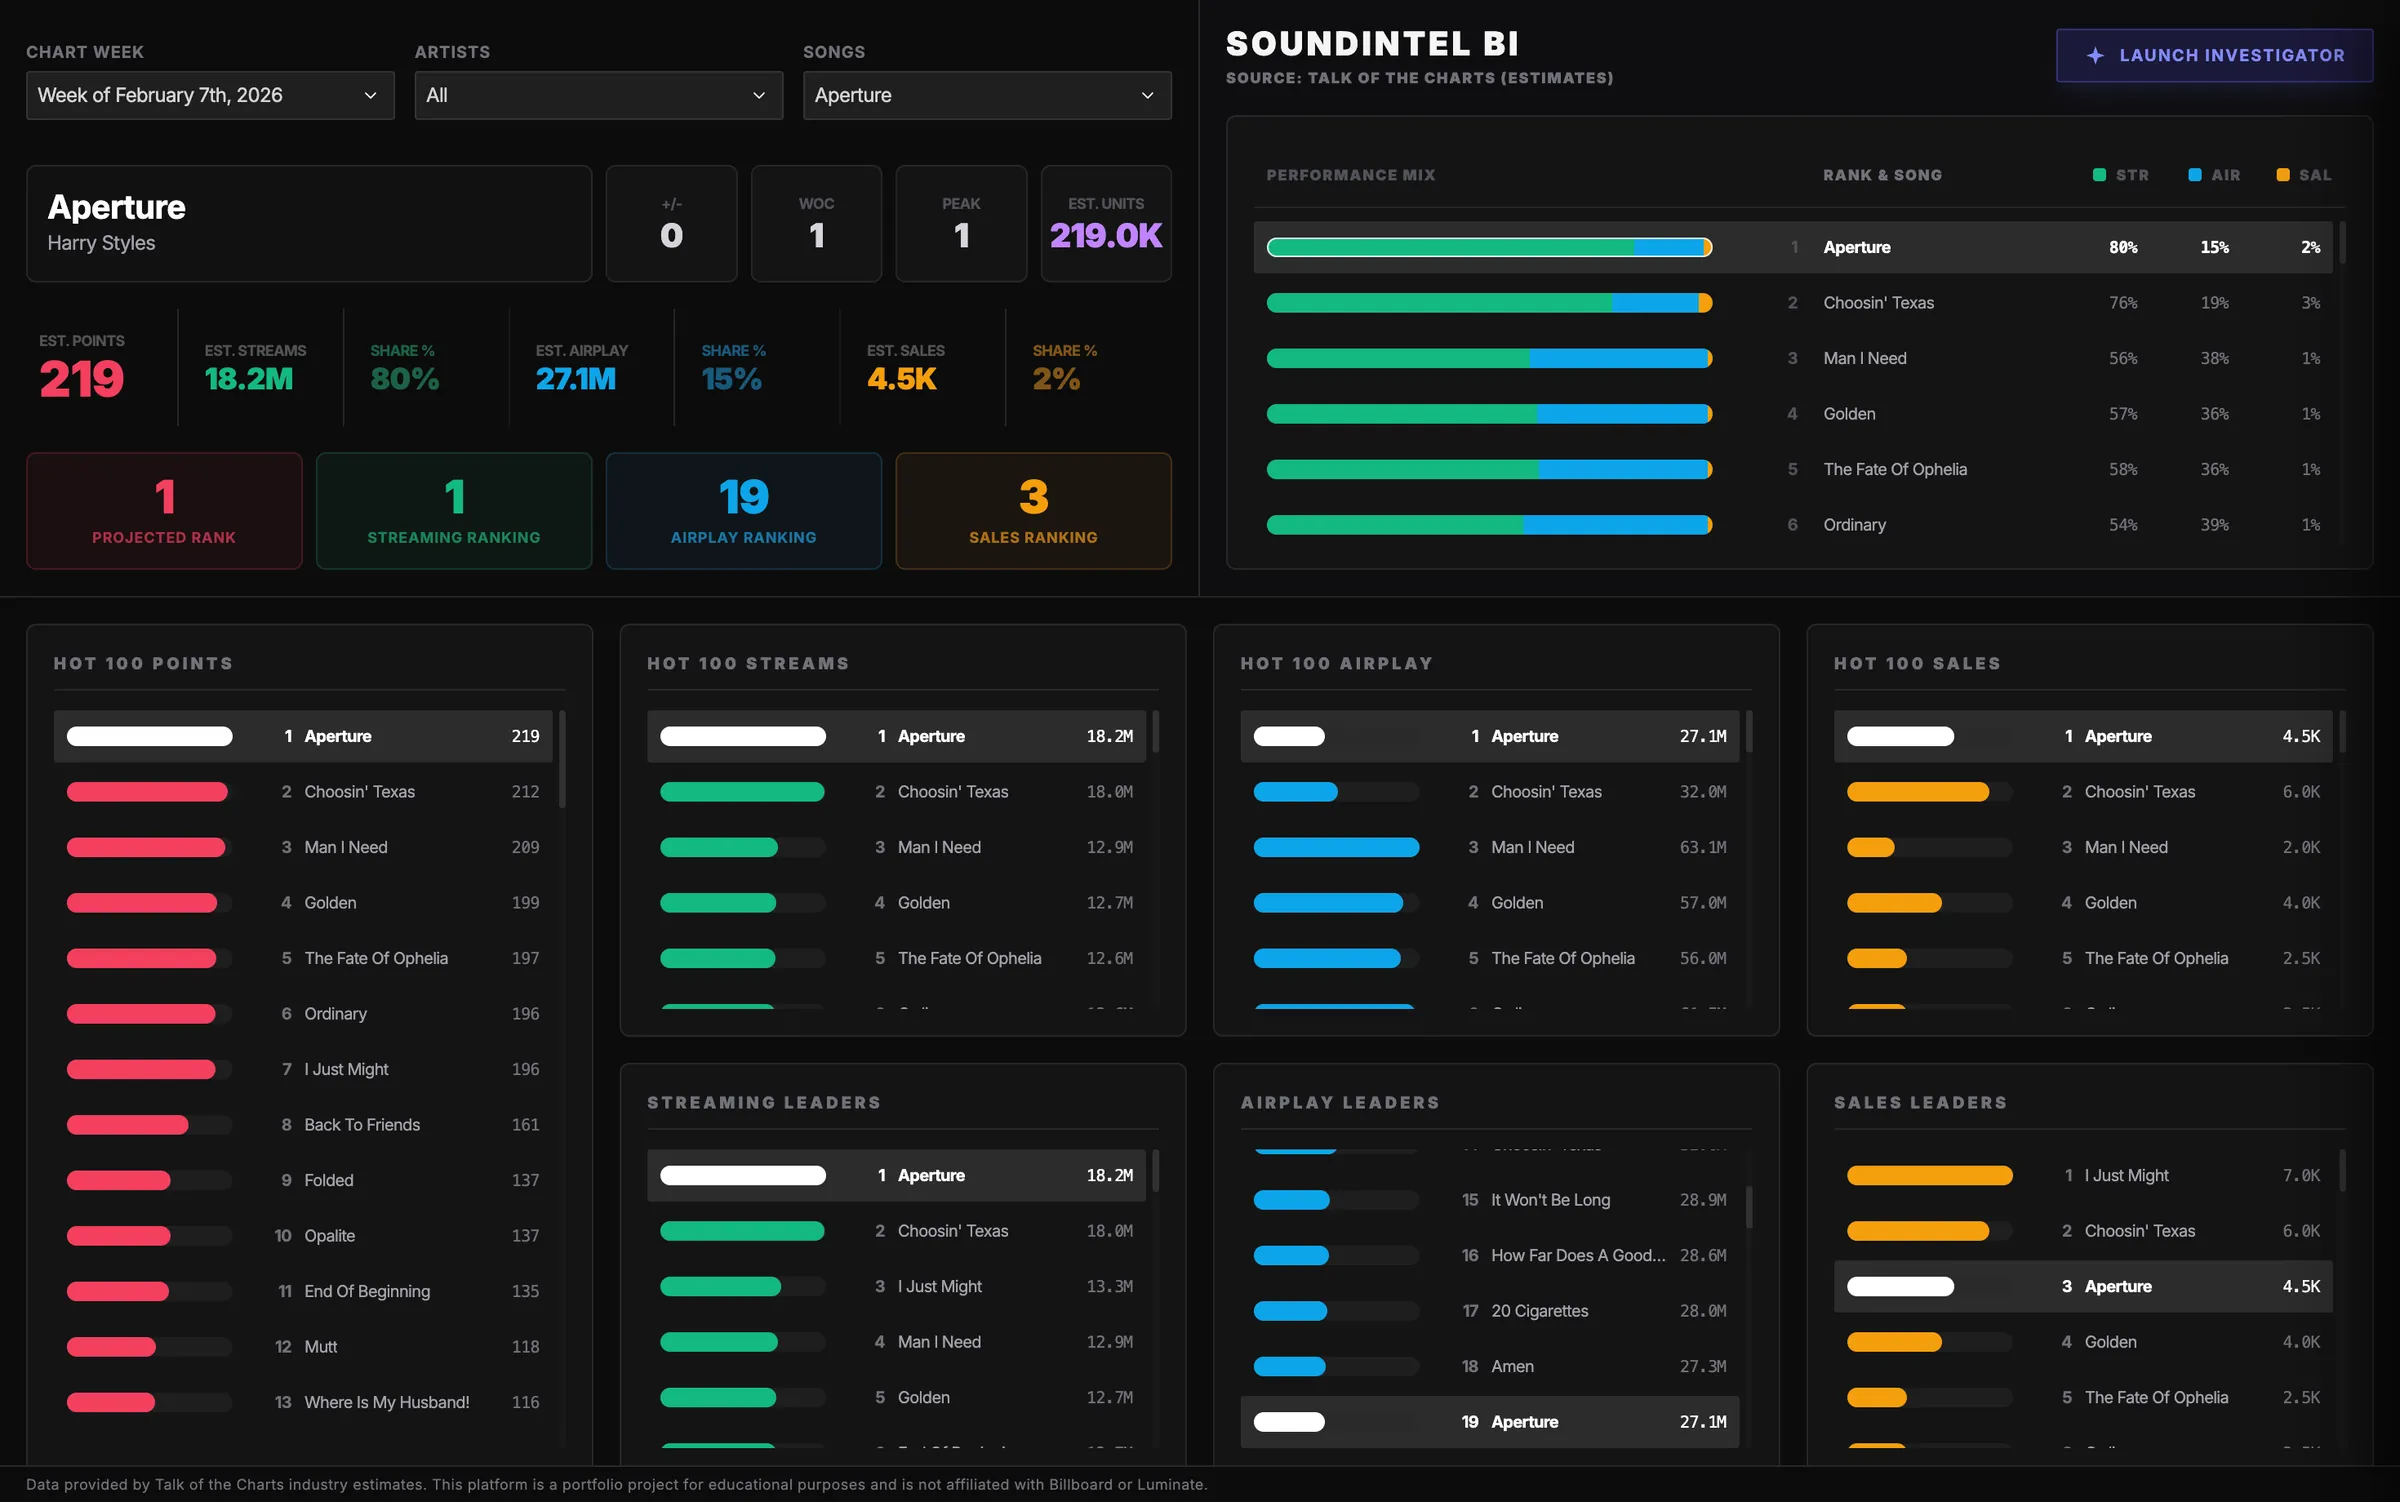
A song’s chart position comes from three things: streams, radio airplay, and sales. Most tools show that as static tables, so answering a simple question, like why a song jumped this week, means cross-referencing several reports.
SoundIntel started as a Power BI dashboard. I moved it to the web to get full control over layout and interaction, and to add a way to ask the data questions directly.
Built for scanning
- The dashboard separates chart position, what drove it, and how songs compare, so each question has one place to look.
- Streams, airplay, and sales are broken out visually, so you can see what is carrying a song without reading numbers.
- The hardest part was density. Chart data is detailed, and every view had to balance showing enough against staying readable.
Ask the Data
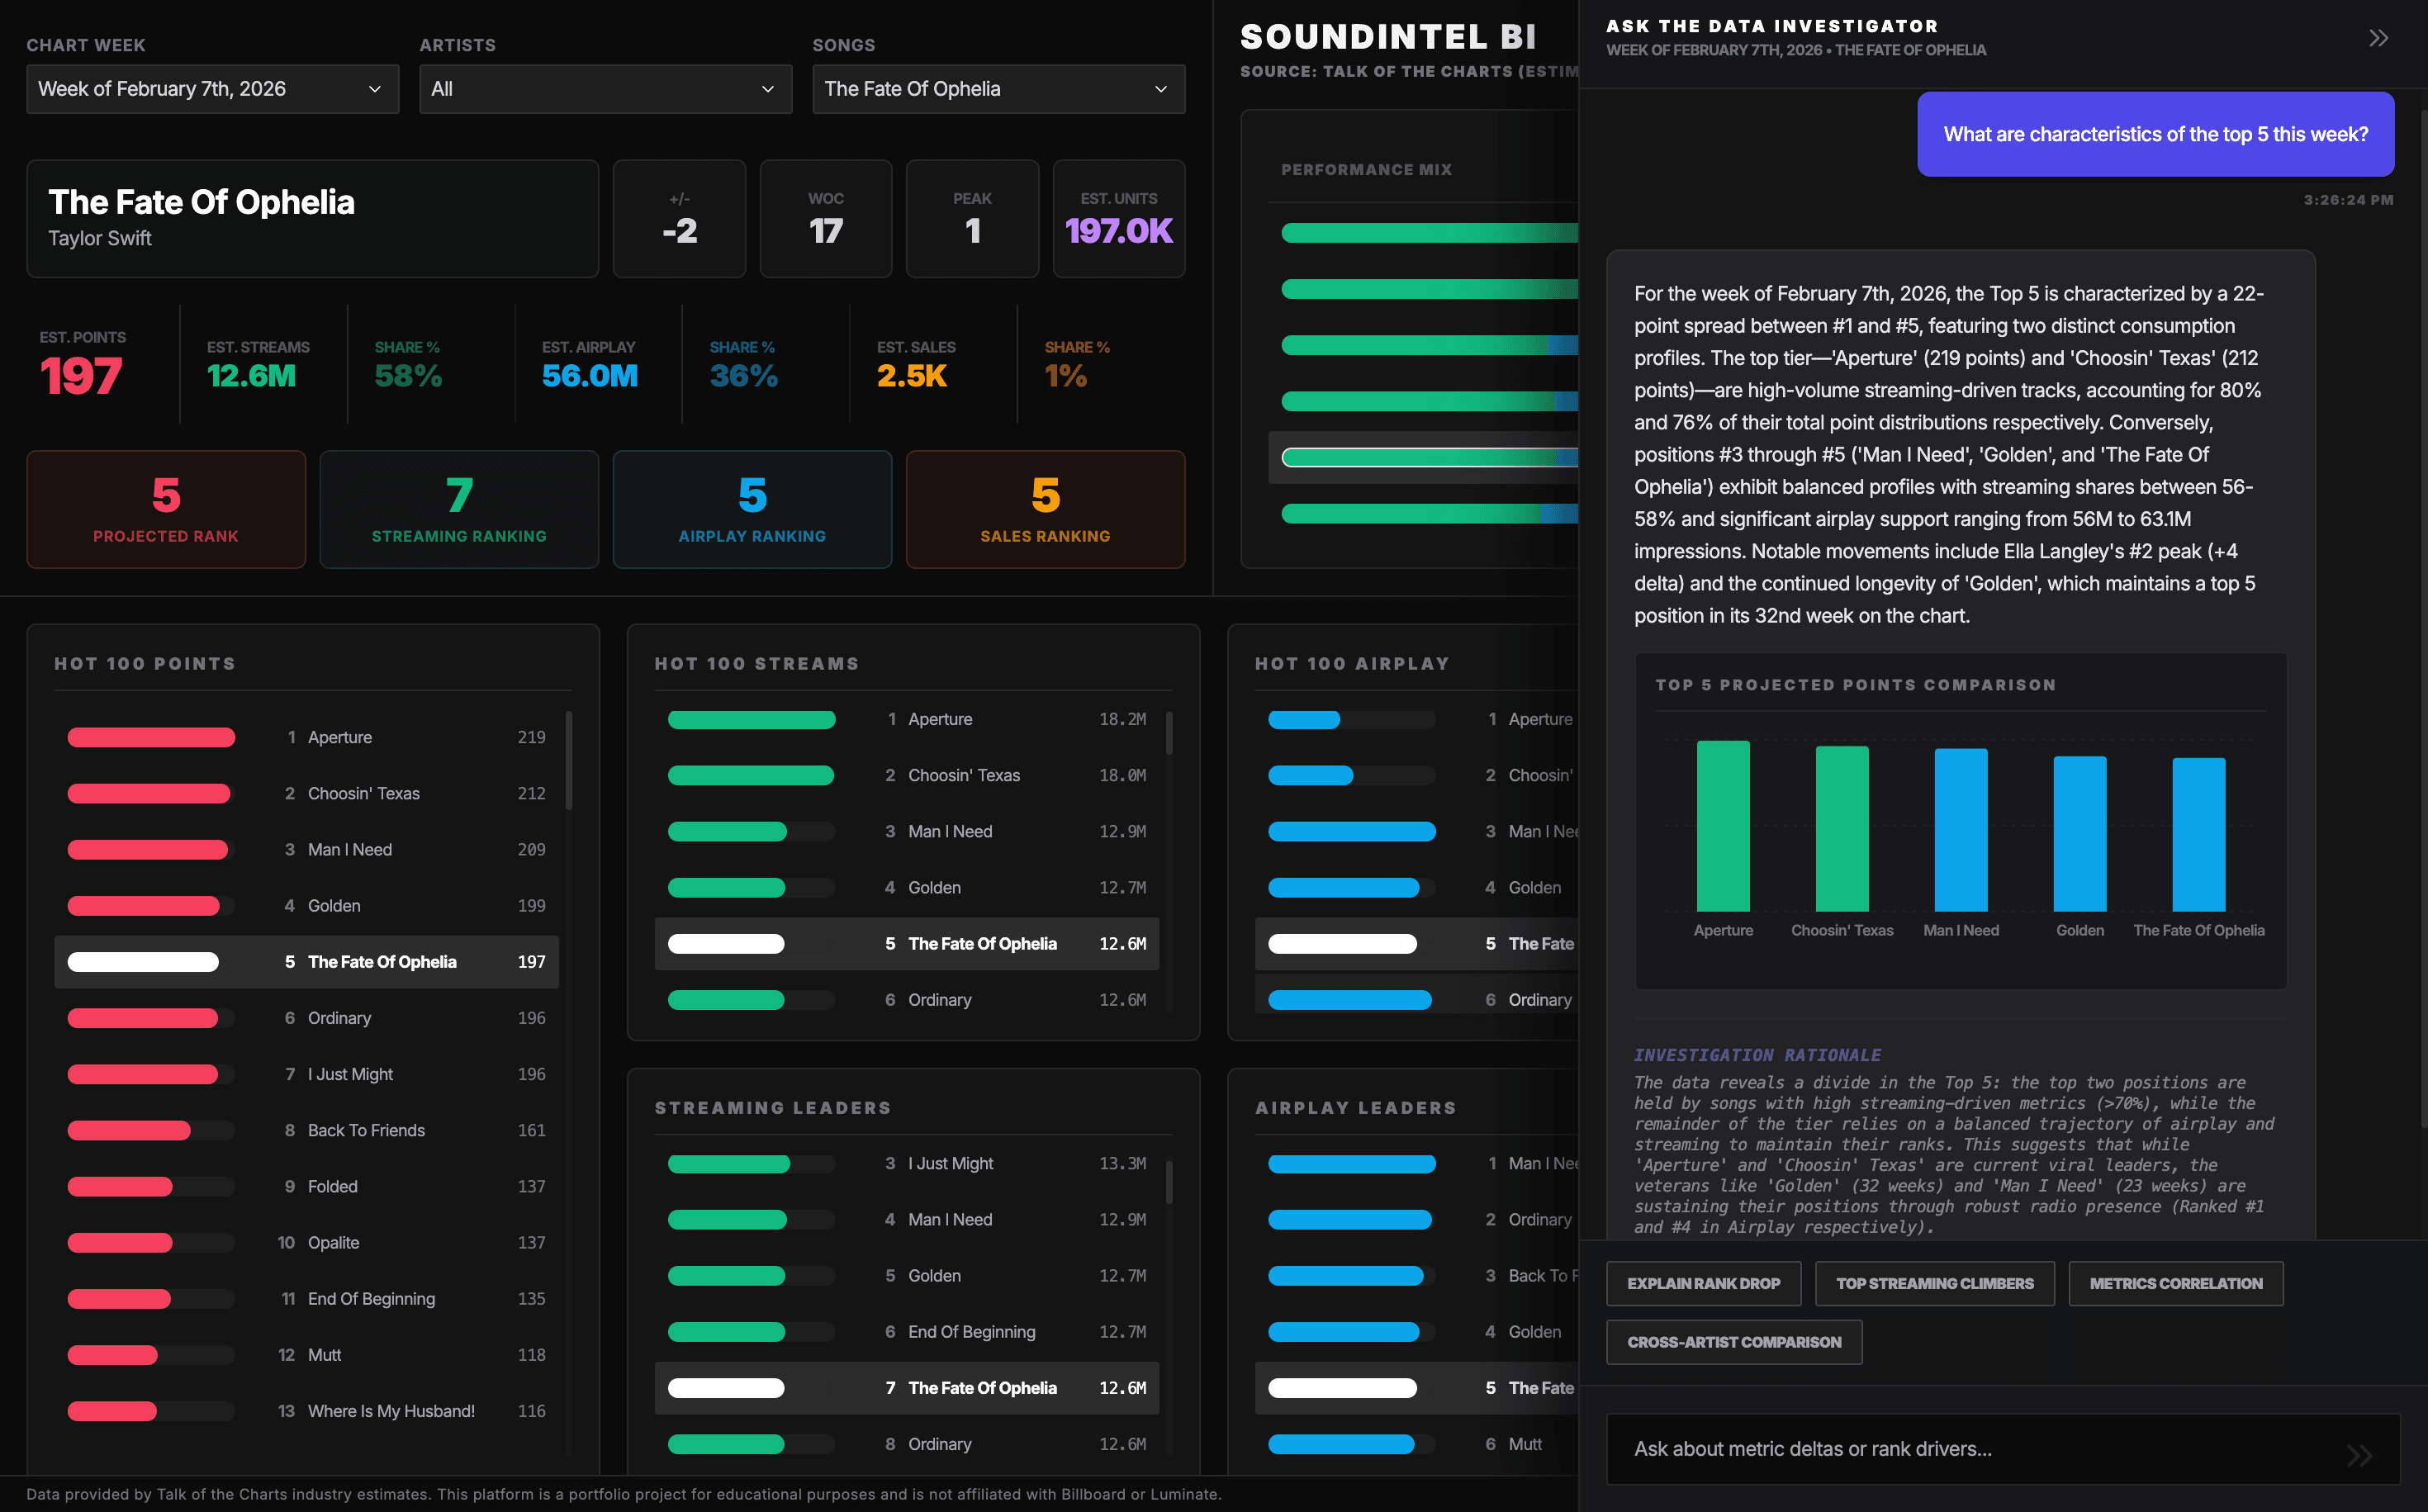
You can type a question and get an answer with a chart. I designed the AI as an analyst rather than an advisor: it explains what is happening, why, and how it compares over time, but it does not tell you what to do. Keeping it to explanation is what makes the answers trustworthy.
What I would do next
- Longer historical comparisons.
- Separate views for executives and analysts.
- Clearer limits on what the AI will answer, shown in the interface.
Results
- Reading the chart went from minutes of reading to seconds of scanning.
- Questions that used to need a custom report can be asked directly.