SoundIntel BI
Interactive Music Chart Analytics Platform
SoundIntel BI transforms Billboard Hot 100–style chart data into an interactive experience that's faster to understand, easier to explore, and more actionable. What started as a Power BI dashboard evolved into a full web application with AI-driven data exploration.
The Problem
Music chart data is dense, fragmented, and often difficult to interpret quickly.
- Weighted complexity. Chart performance is driven by streams, airplay, and sales—but most tools present these in static tables or PDFs.
- Manual comparisons. Answering simple analytical questions requires cross-referencing multiple reports.
- BI limitations. Tools like Power BI are powerful, but restrictive in layout, interaction design, and AI integration.
- Reporting over exploration. Existing dashboards focus on what happened, not why.
Insights that should take seconds often take minutes—or are missed entirely.
The Solution
A web-based analytics platform that prioritizes clarity, exploration, and explainability.
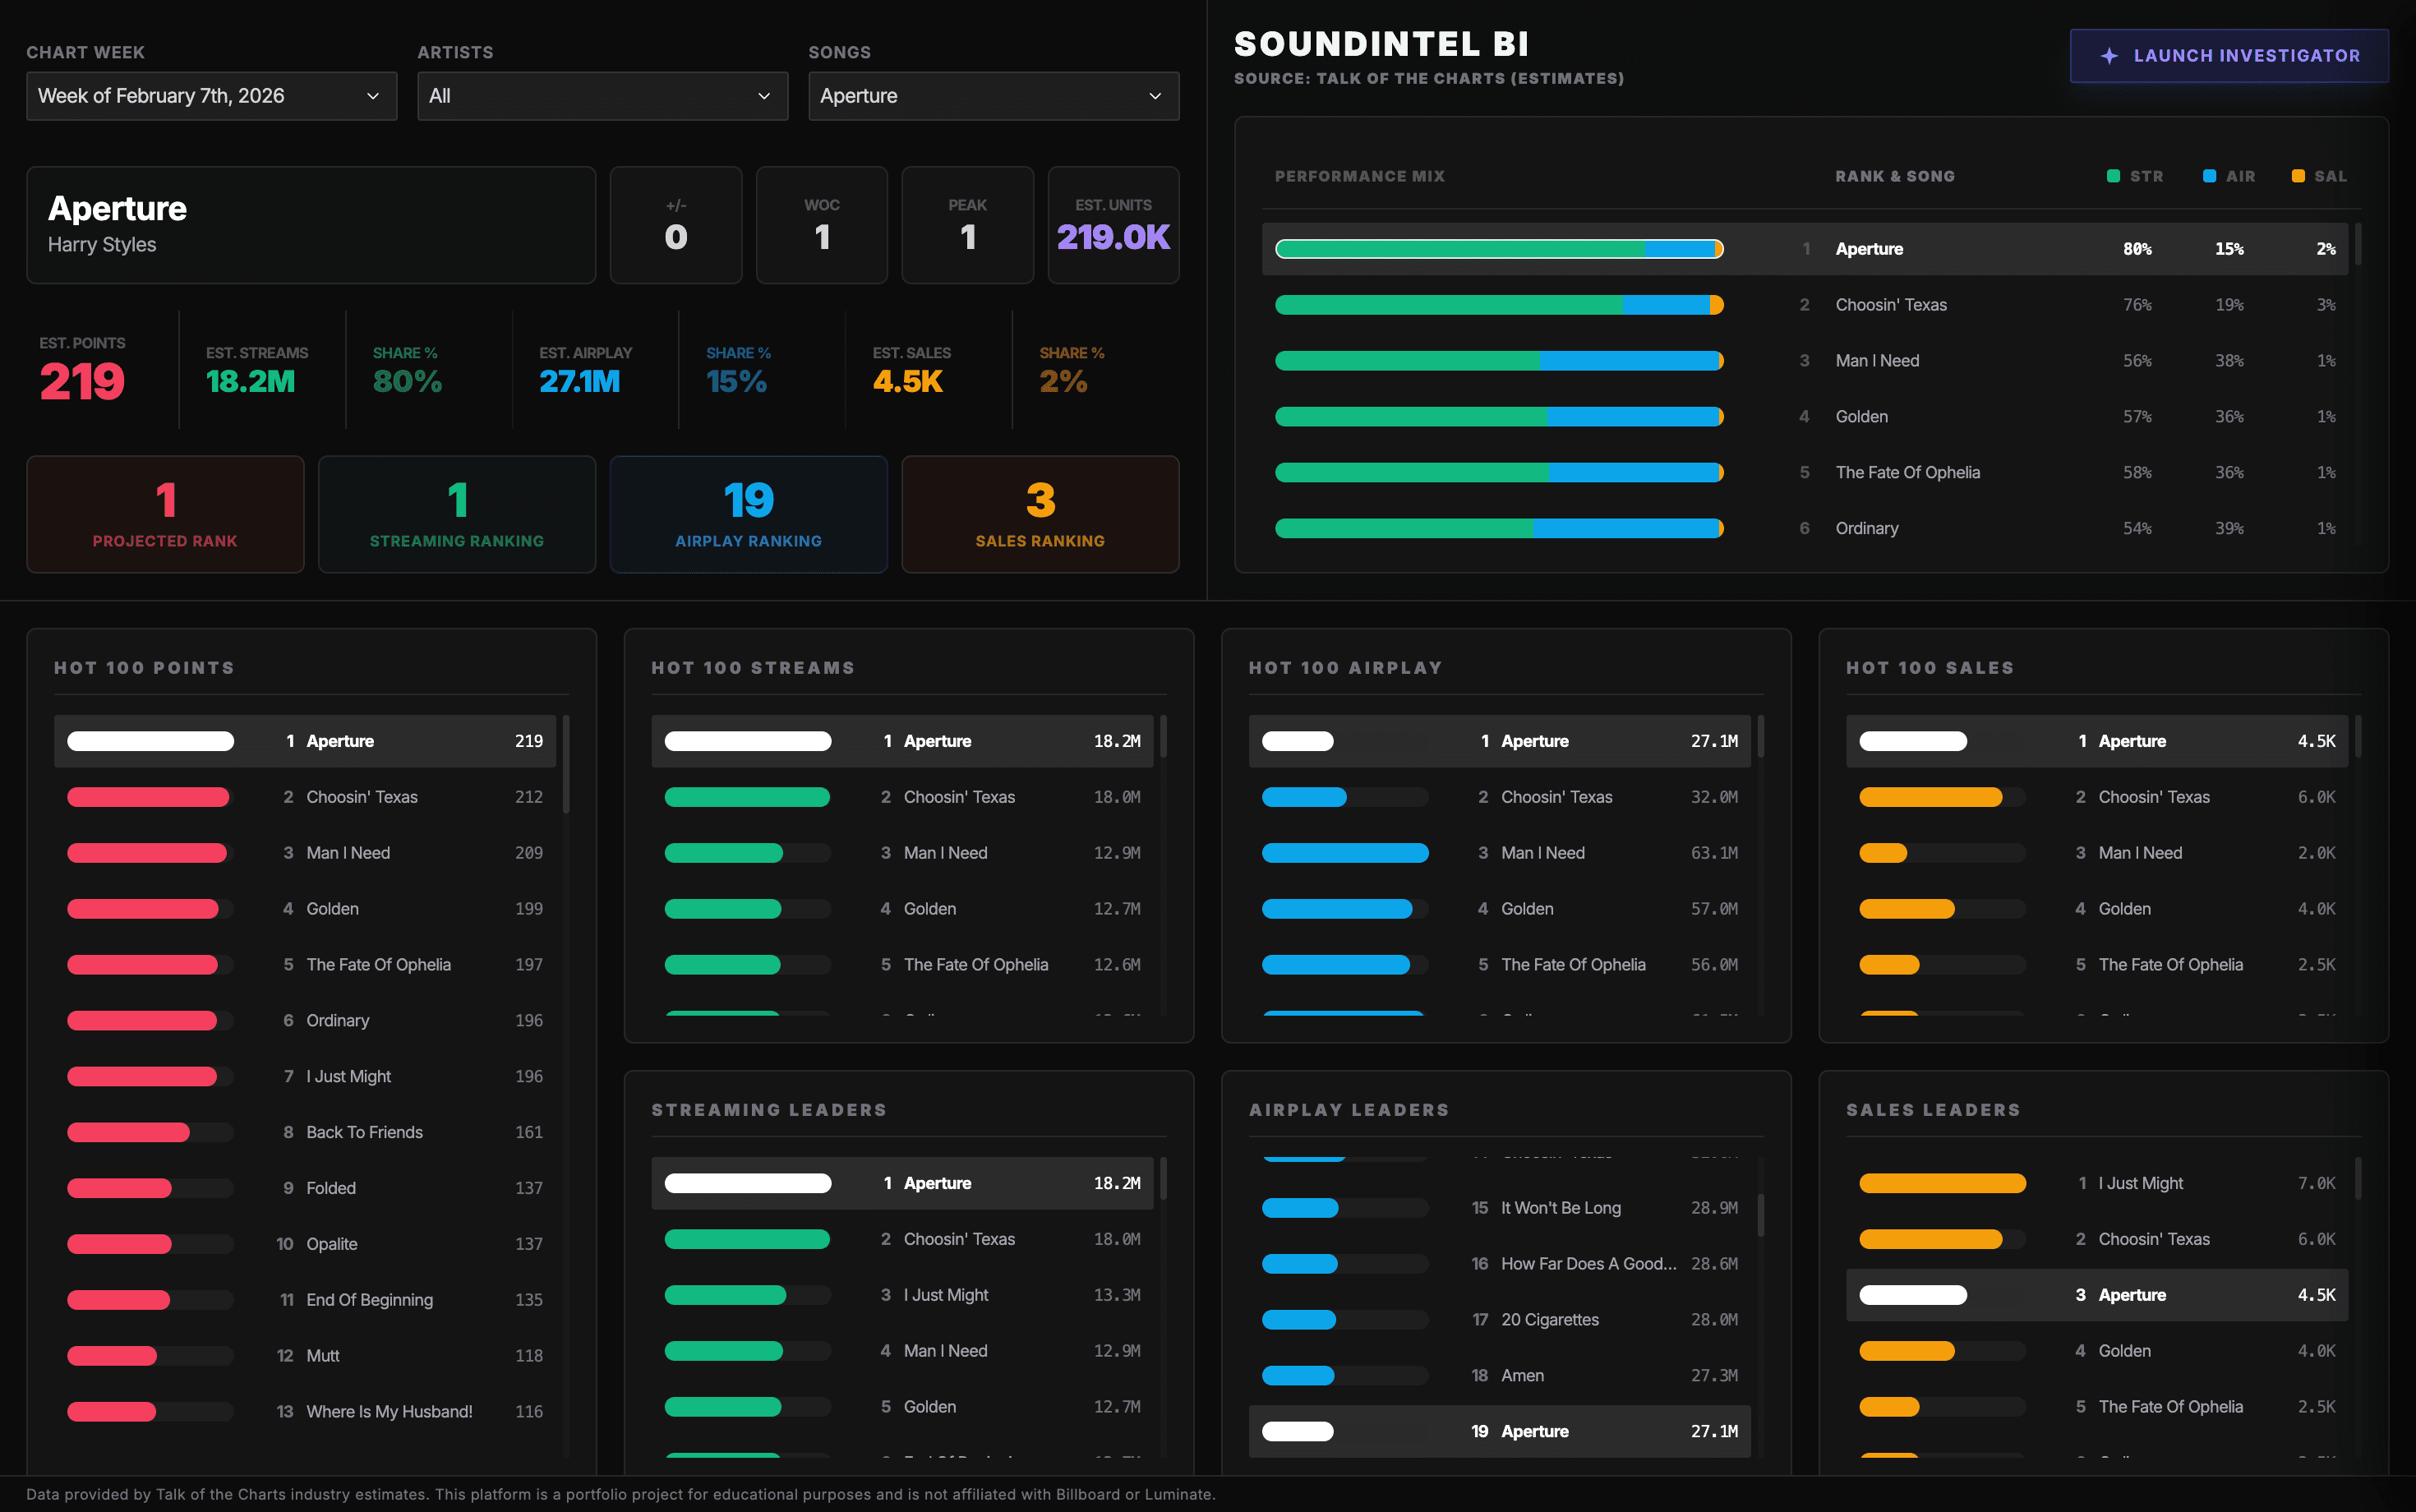
- Modular dashboard separating chart position, performance drivers, and comparative rankings
- Visual breakdowns of how streams, airplay, and sales contribute to chart outcomes
- Full control over layout, interaction, and design (beyond Power BI constraints)
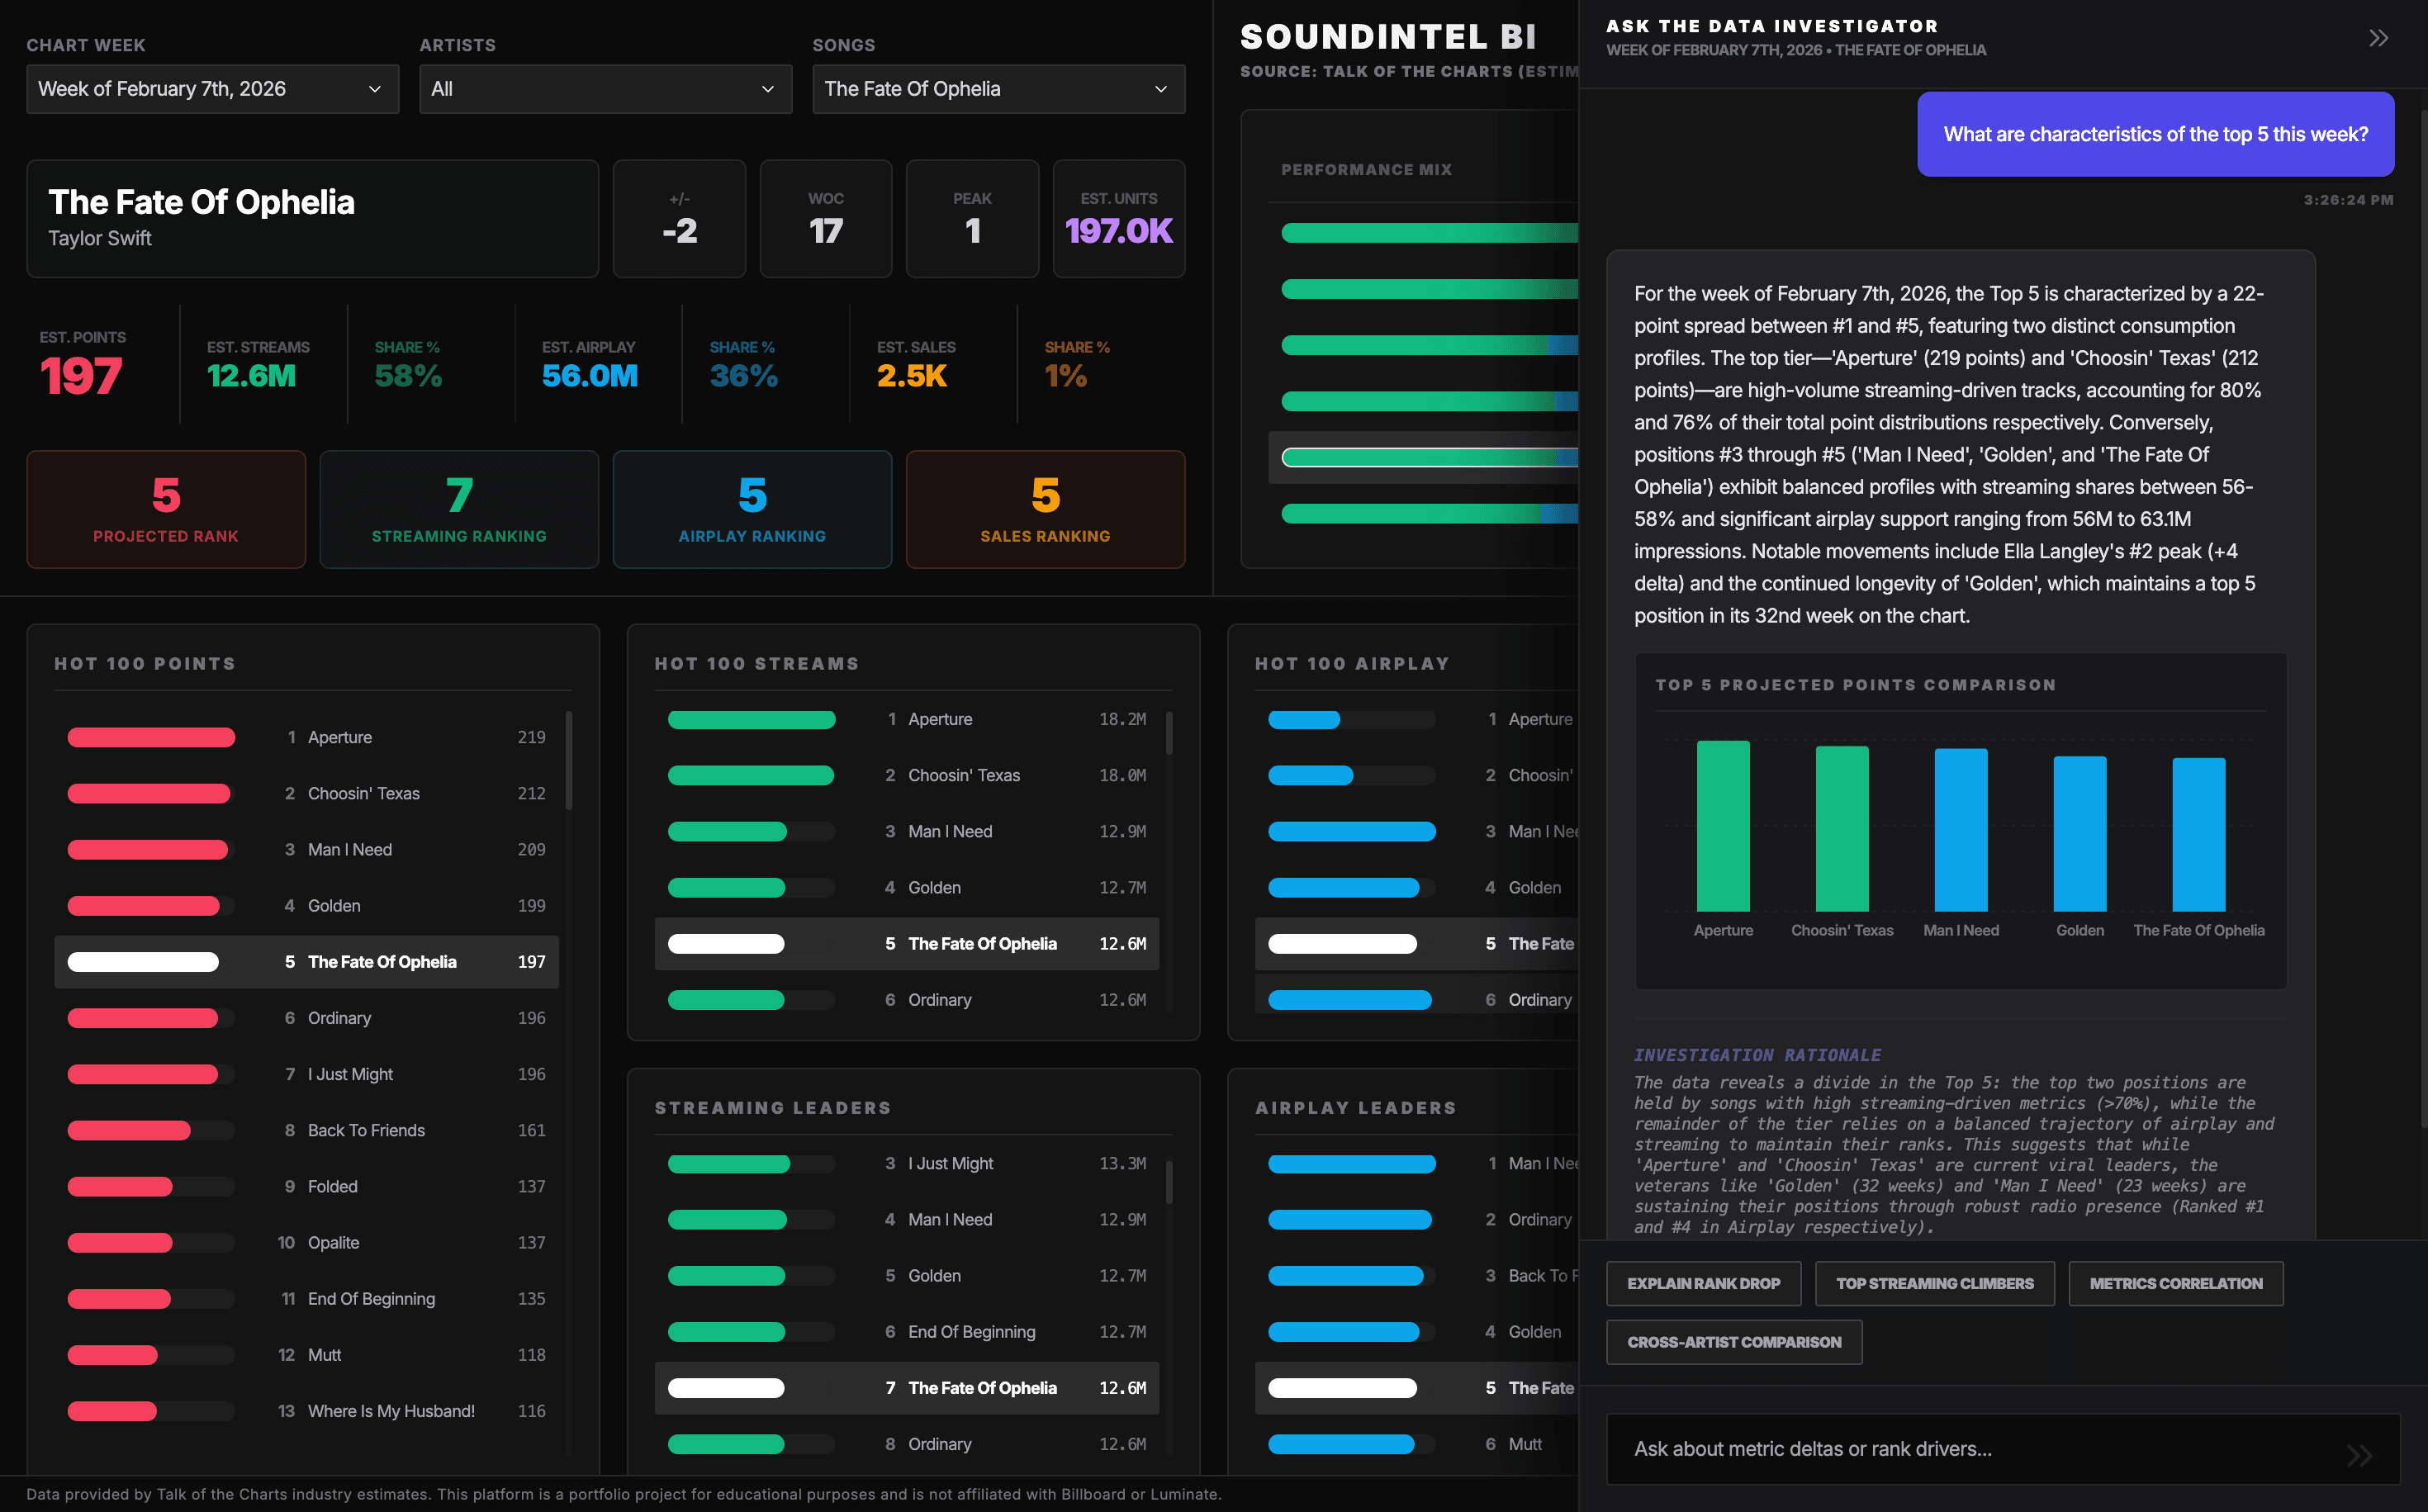
- AI-powered "Ask the Data" investigator for conversational data discovery
Rather than telling users what to do, the AI explains what is happening, why it's happening, and how metrics compare over time.
The Dashboard
Ask the Data
Tech Stack
Impact
- Faster insights. Reduced chart interpretation from minutes of reading to seconds of scanning.
- Ad-hoc analysis. Enabled questions that previously required custom views or manual calculations.
- AI as explainer. Demonstrated how AI can enhance BI through explainability rather than automation.
- Full-stack showcase. Blends data engineering, UI/UX design, and applied AI in one product.
Challenges & Learnings
- Trustworthy AI. Designing AI features that feel reliable required reframing AI as an analyst, not a strategist.
- BI → Web. Translating BI logic into a web app forced deeper thinking about data modeling and state management.
- Density vs. clarity. Balancing information density with visual clarity was an ongoing design challenge.
- Control vs. speed. Migrating from Power BI highlighted the tradeoff between rapid prototyping and creative freedom.
What I'd Do Differently
- Introduce automated data validation earlier for edge cases in estimated chart data
- Expand time-series analysis for longer historical comparisons
- Add role-based views tailored to executives versus analysts
- Formalize AI guardrails sooner to reinforce trust and consistency
Skills Demonstrated
Structured chart and performance tables with PostgreSQL, normalized schema design
Custom React components inspired by enterprise BI patterns
Next.js, React, Tailwind CSS with responsive dashboard layouts
Python FastAPI endpoints for chart data and AI integration
Natural language querying with contextual memory and automated chart generation
Evolved from Power BI prototype to custom web platform based on user needs
Live Preview
Live: soundintel-bi.vercel.app